
In introductory units on functions, algebra 1 students become proficient in graphing a function rule representing a function and learn how to distinguish between discrete and continuous functions.
Although some students may experience this topic as challenging, math teachers can help out by applying diverse teaching strategies. In this article, we share a few such strategies. Use them in your class and see your students’ knowledge soar in no time!

How to Teach Graphing a Function Rule
What Is a Function Rule?
For starters, explain what a function rule is. You can define it as a mathematical rule that can be used to describe the general trend of the function. A rule can be taken as an equation representing any relationship. A function rule can be used to interpret the function as a graph.
You can also include this video that contains a simple explanation of the difference between an equation and a function, as well as the overlapping areas between the two. In addition, you can also play this video that explains how to obtain a function from an equation.
How to Graph a Function Rule
Point out to students that when we’re given a function rule, we can make a table of values satisfying the function rule and graph these points to discover the shape of the function. Add that now we will cover two types of function graphs:
- linear function graphs
- nonlinear function graphs
Students have already learned in previous lessons what linear and nonlinear functions are, but it’s always good to review this. Remind students that a function is linear if its graph makes a straight line, whereas the graphs of nonlinear functions aren’t straight lines (ex: parabola).
Example:
Tell students that you will demonstrate how to graph the following function rule: y = 2x + 1. As mentioned earlier, we’ll begin with a table of values that will satisfy the given function rule. Then we’ll graph each of the points from the table.
More specifically, we’ll select x-values and plug them into the function rule. By doing this, we’ll be able to get the y-values. Once you plug those values into the equation, you will get a y-value. These x-values and y-values represent the coordinates for a single point. Then, we’ll connect the dots.
For instance, you can use the following table:
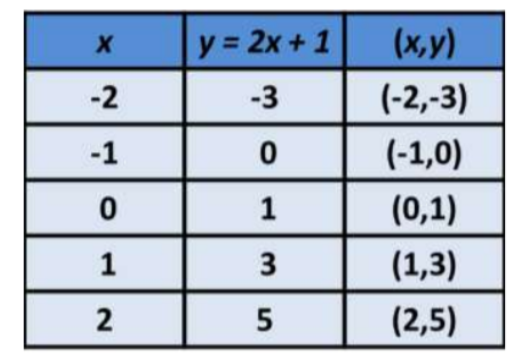
So if x = – 2, by plugging this value into y = 2x + 1, we’ll obtain the following:
y = 2 (- 2) + 1
y = – 4 + 1
y = – 3
This means that the ordered pair (x, y) will be (- 2, – 3). By applying the same process with the other x-values, we obtain these ordered pairs (- 2, – 3), ( -1, 0), (0, 1), (1, 3), (2, 5). Now the only thing left to do is to plot each of these points on the graph. Thus, we produce the following:
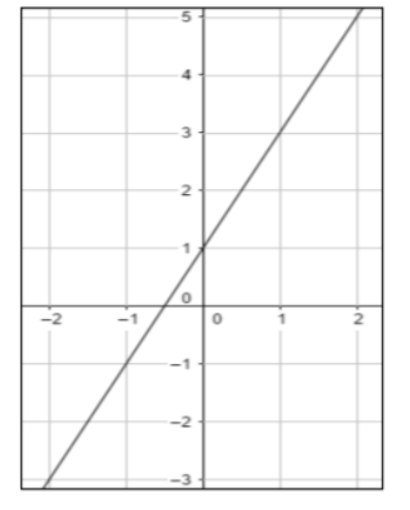
Point out that this graph represents the graph of the function rule y = 2x + 1. Ask students to analyze the graph and reflect – does this graph represent a nonlinear graph or a linear one? How do they know?
Discrete and Continuous Graphs
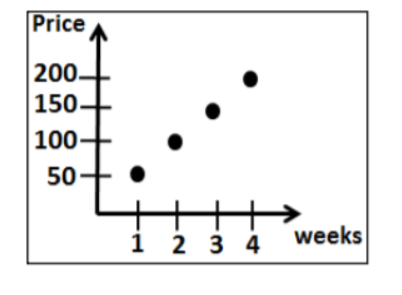
Once students are comfortable with graphing any function rule, you can proceed with explaining what the difference between discrete and continuous graphs is. Explain that a discrete graph is composed of distinct isolated points on the graph. Present an example on the whiteboard:
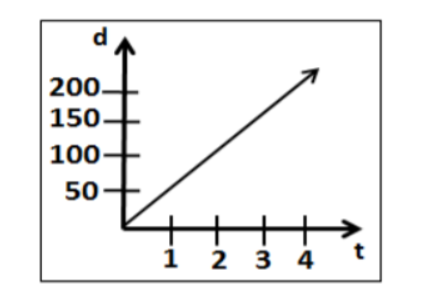
Then, explain that a continuous graph, on the other hand, is a graph that is unbroken and data exists between plotted values. Draw a continuous graph on the whiteboard and demonstrate this to students:
Use this video in your classroom to illustrate a real-life example of discrete and continuous graphs. The video contains an example of a local cheese maker who’s making cheddar cheese to sell at a farmer’s market.
The video shows the amount of milk used to make the cheese and the price at which the cheese is sold. By first writing a function and graphing it, students can learn to identify whether the graph is discrete or continuous.

Activities to Practice Graphing a Function Rule
Pair Work
This activity will help students improve their skills at graphing a function rule. To implement this activity in your classroom, the only thing you’ll need is this Assignment Worksheet (Members Only). Print out enough copies for all students (one per student).
The worksheet contains exercises where students are asked to make a table of values of each given function and then graph each function rule using this table of values, as well as determine whether the function is continuous or discrete.
Pair students up and hand out the copies. Explain that pairs work together to solve the math exercises in the worksheet. After each person has finished their worksheet, they go through the exercises of the student they’re paired with and provide feedback to each other.
Function Rule Machine Game
This is a game that will help students practice graphing a function rule, as well as identifying whether the function is continuous or discrete. To use this game in your class, you’ll need construction paper, scissors, and markers.
Draw ‘machines’ resembling a table on the construction paper and enter x-values in each machine. Leave the y-values field of the table empty. The machine also contains a function rule and a problem that needs to be solved and graphed so that the machine starts working.
An example of such a problem is as follows:
‘The amount of water w in a swimming pool, in liters, depends on the amount of time t the swimming pool is filled with water and is related by the function rule w = 1.5t. Graph each function rule and then tell whether the function is continuous or discrete.
Create several such machines, depending on the size of the class (there should be one machine per group). Divide students into groups of 3, 4 and hand out a machine to each student.
Explain they need to solve for y and graph the function rule so that the machine works again. Provide a few minutes for this. The group that manages to graph the function rule first, as well as correctly identify if it’s continuous or discrete, wins the game.
Before You Leave…
If you liked the teaching strategies on graphing a function rule that we outlined in this article, we have a whole lesson that is dedicated to this topic!
So if you’re looking for more math materials for children of all ages, sign up for our emails for plenty of free content! Feel free to also head over to our blog, and check out our free resources on patterns, equations, and graphs!
And if you’d like to become a member, sign up at Math Teacher Coach!
This article is based on:
Unit 4 – An Introduction to Functions