
In units on functions in algebra 1, one of the first things that students learn is using graphs to relate two quantities, in addition to graphing the data in a table and relating the variables in the table using the data.
Even though functions may come across as scary for many students, math teachers can prepare diverse teaching strategies to make these early lessons accessible.
Without further ado, if you’re teaching using graphs to relate two quantities, here are some great guidelines that you can follow to help you best prepare for success in your lessons!
How to Teach Using Graphs to Relate Two Quantities
Reading Graphs
You can start your lesson by reminding students what a graph is and how we can read it. Simply put, a graph is a diagram that we use to visually show the relationships between data. Explain that we rely on three things to analyze a graph:
- the title of the graph
- the axes
- the relation between the axes (this is how we know if we have a constant relation, a linearly decreasing relation, or a linearly increasing relation).
Point out to students that the title refers to the way we summarize what the graph shows. This needs to be adequately summarized as ‘y-axis variable versus x-axis variable’.
Once you do that explain that the axes are x and y, x being the horizontal line whereas y the vertical one. Proceed by explaining the different relations:
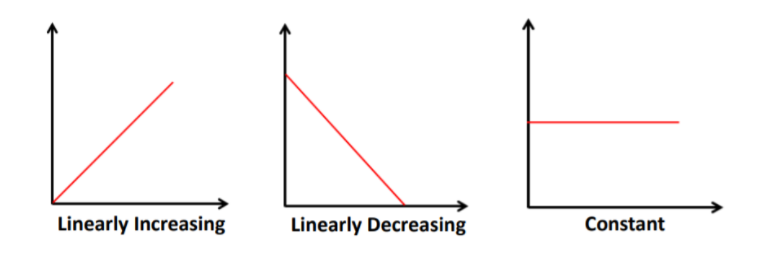
- constant relation: when one quantity becomes bigger, and the other quantity stays the same (that is, constant) in a graph relating two quantities, we say that the graph has a constant relation.
- linearly increasing relation: when one quantity becomes bigger and the other quantity also becomes bigger in a graph relating two quantities, we say that this graph is linearly increasing
- linearly decreasing relation: when one quantity becomes bigger and the other quantity becomes smaller in a graph relating two quantities, we say that this graph is linearly decreasing.
Illustrate the three mentioned relations by drawing three different graphs:
Example:
Provide a practical example, preferably from everyday life that students can relate to and draw a graph based on it. For instance, present how a plant is growing over a given period of time with the help of a graph.
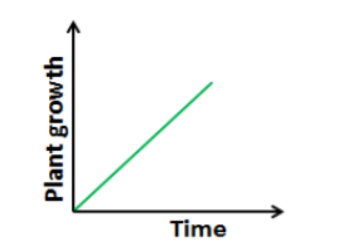
Now ask students to identify what the variables are and what kind of a relation we can observe between these variables? Point out that we can observe that the axes are plant growth and time. The graph is linearly increasing, meaning that plant growth increases as time increases.

Data Table
Explain to students that we can also use a table to present the relationship between two quantities. For instance, let’s say we want to show how the number of DVDs bought relates to the total cost. Draw a graph. Then, draw a table and insert the data in the following way:
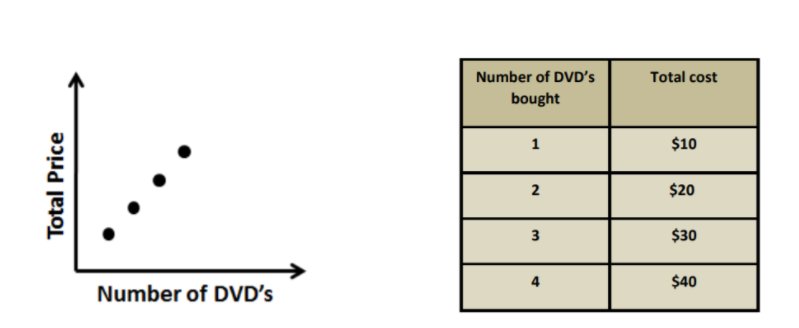
Point out that by analyzing the data from the graph and the table, we can observe that the relation between the number of DVDs bought and the total cost is a linearly increasing relation. That is, as the number of DVDs bought increases, the total price also increases.
Launch a Video Lesson!
After having provided a brief introduction on what graphs are and what the relations between the x and y axes are, you can play a video in the classroom in order to better illustrate using graphs to relate two quantities.
For example, you can use this fun video. It contains a graph that illustrates the volume of air in a balloon as you blow it up until it pops. The axes are y (time) and x (time), showing that each time you blow the balloon, the volume increases. Open a discussion once the video ends!
Activities to Practice Using Graphs to Relate Two Quantities

Matching Graphs and Tables Game
This activity will help students practice their skills at recognizing how to use a table to present the relationship between two quantities. To implement this activity in your classroom, you’ll need two sets of cards, preferably in two different colors (ex: one red and the other one green).
On the red set of cards, draw diverse graphs representing the relation of two given quantities (one graph per card), whereas on the green cards, draw a data table that shows the relation between these quantities (again, one table per card).
Make sure there is one matching table for every graph, that is, one green card for every red card. Divide students into groups of 3 or 4 and hand out a pile of cards in each group. The cards remain facing downward until you give students the signal to start the game.
Explain to students that they need to work as fast as possible together with the other members of their group to outrace the other groups in matching the cards. The first group that manages to correctly match all the cards wins the game.
Pair Work
This activity will help students practice how to relate two quantities by using graphs, as well as how to graph the data in a table and relate the variables in the table using the data. To use this activity in your classroom, print out this Assignment Worksheet (Members Only).
Pair students up and hand out the worksheets (one worksheet per child). Explain that the worksheet contains diverse exercises where students are asked to identify the relation between given variables on a graph or create a table or a graph based on different scenarios.
Students work independently in their pairs. After they’ve completed their worksheet, they review the exercises and discuss them together with the other student in their pair. Homeschooling parents can adapt this activity so it’s individual.
Before You Leave…
If you liked the guidelines on teaching how to use graphs to relate two quantities that we outlined in this article, we have a whole lesson that is dedicated to this topic!
So if you’re looking for more math materials for children of all ages, sign up for our emails for plenty of free content! Feel free to also head over to our blog, and check out our free resources on patterns, equations, and graphs!
And if you’d like to become a member, sign up at Math Teacher Coach!
This article is based on:
Unit 4 – An Introduction to Functions
- 4-1 Using Graphs to Relate Two Quantities
- 4-2 Patterns and Linear Functions
- 4-3 Patterns and Nonlinear Functions
- 4-4 Graphing a Function Rule
- 4-5 Writing a Function Rule
- 4-6 Formalizing Relations and Functions
- 4-7 Arithmetic Sequences