
Inequalities and their graphs is one of the starting lessons in algebra 1 when learning how to solve inequalities. This is when students become fluent in recognizing and checking solutions of inequalities, as well as in graphing inequalities.
Even though this topic may come across as confusing for some students, there are various ways in which math teachers and homeschooling parents can help children master inequalities. To help out, we’ve outlined a few teaching strategies. Read on to learn more.
Strategies to Teach Inequalities and Their Graphs
What Are Inequalities?
You may want to start your lesson on inequalities and their graphs by defining inequalities. Even though children are probably familiar with what inequalities are from earlier grades, it’s always good to brush up on previously acquired knowledge.
You can define an inequality as a mathematical statement comparing values of two expressions with the help of an inequality symbol and thus showing whether one value is less than, greater than, or equal to the other. In fact, there are five inequality symbols that we use for this purpose.
Inequality Symbols
You can also write a table with the inequality symbols on the whiteboard and list the corresponding verbal expression under each:

So the first symbol on the table (starting from the left), is <. The verbal expression corresponding to this inequality symbol is ‘less than’, but you also point out to students that we can use additional expressions, such as:
- is smaller than
- is fewer than
- is under
- is below
- beneath
- is shorter than, etc.

The second inequality symbol is >. The verbal expression corresponding to this symbol is ‘greater than’. Point out to students that there are several other verbal expressions that we can use for this symbol, including:
- is more than
- larger than
- above
- over
- exceeds
- higher than
- increased etc.
The third inequality symbol is ≤, for which we normally use the verbal expression ‘less than or equal to’. You can also add that we can sometimes use the following verbal expression for this inequality symbol:
- is not greater than
- is at most
- maximum
- is no more than, etc.
≥ is the fourth inequality symbol on the above table, which we usually read as ‘greater than or equal to’. You can also mention that we sometimes use the following verbal expressions instead of ‘greater than or equal to’:
- is at least
- is no less than
- minimum
- top etc.
Finally, the fifth inequality symbol is ≠, which means ‘is not equal to’. You can point out to students that we sometimes use other verbal expressions for this inequality symbol as well, such as:
- is not the same as
- differs from
- is different from etc.
Determining If an Inequality Is True
Now that students understand what inequalities are and what are the inequality symbols, they can easily determine whether an inequality is true or false. Write a few examples of different inequalities on the whiteboard and illustrate this process step-by-step.
For instance:
5 + 6 ≥ 10 + 2
You can start by reading the inequality, that is 5 + 6 is greater than or equal to 10 + 2. Explain that in order to determine if this is true or false, we first need to do the operations, i.e. addition, on both sides so as to simplify the statement.
By adding the numbers, we’ll get:
11 ≥ 12
Then, we can read this inequality as 11 is greater than or equal to 12. Ask students if this makes sense to them. Since any algebra 1 student in the class could already tell you that 11 is less than 12, we say that this inequality is false.

What Are Solutions to Inequalities?
You can point out to students that, in this early lesson, you won’t be going into more complicated processes of how to solve inequalities, but rather, you’ll only focus on checking solutions to inequalities.
What does that mean? Well, you can explain that to check if a certain value is a solution to an inequality, we just need to substitute the variable in the inequality with this value and then see whether the produced statement is true.
If the statement is true, we can consider this value (i.e. number) as a solution to the given inequality. If, however, substituting the given number for the variable results in a false statement, we can say that this number is not a solution to the inequality.
You can provide a few examples of how this would look in practice. Write an inequality on the whiteboard, such as x – 5 ≥ 1. Ask students to read the inequality out loud. By now, they should be able to tell you that we read it as ‘x – 5 is greater than or equal to 1’.
Then, explain that we’re asked to check whether 6 is a solution to this inequality. The first thing we need to do is replace this number for the variable x in the given inequality, which will result in the following statement:
6 – 5 ≥ 1
Point out that we’ll then simplify the statement by performing the subtraction, which will produce the following:
1 ≥ 1
Read the statement out loud, i.e. 1 is greater than or equal to 1. Since we know that 1 is indeed equal to 1, this would imply that we produced a true statement by replacing 6 for the variable. In other words, 6 is a solution to x – 5 ≥ 1!
Graphs of Inequalities
At this point, you can explain to children how to graph inequalities, or how to present them graphically on a number line. You can define the graph of an inequality as the set of points on a number line that represent all solutions to the inequality.
Open Circle Graphs
Draw a number line on the whiteboard and start with simple examples of graphs of inequalities on a number line, such as x < 0, x > 0, x ≤ 0, and x ≥ 0. You can start with x < 0. Graph it on the number line in the following way:
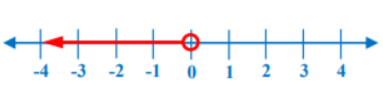
When teaching inequalities and their graphs, you should explain that when we graph x < 0, we start from the verbal expression, i.e. x is less than 0. Does x include zero? No. We’ll draw an arrow to the left, starting from zero, but not including zero, because these are the values smaller than zero.
Point out to students that if we have an open circle (such as in the cases when x < 0 or x > 0), we’re not including the endpoints, whereas if we have a closed circle (like in the cases when x ≤ 0 or x ≥ 0) we are including the endpoints. The endpoints are zeros here.
Now move on to x > 0, which you can graph in the following way:
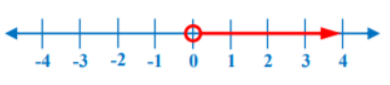
Again we read the verbal expression of the inequality, x is greater than 0. Does x include zero? No. So x is any number greater than 0, but not including 0. We’ll draw an arrow to the right, starting from 0, because these are the values greater than 0.
Closed Circle Graphs
Now you can demonstrate how we graph inequalities when we need to include the endpoints. As mentioned earlier, this is done with the help of closed circles. Draw the graph of x ≤ 0 to illustrate this visually:
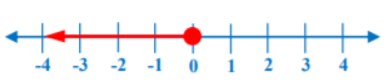
Explain that to graph x ≤ 0, we read the verbal expression, i.e. x is less than or equal to 0. So in this case, since x can also be equal to 0, we’ll include 0 by shading the circle and creating a closed circle.
We’ll draw an arrow to the left, starting from zero (and including zero) because these are the values smaller than zero.
Finally, you can show students how to graph x ≥ 0:
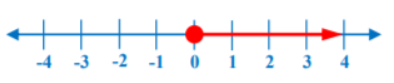
Explain that the verbal expression is x is greater or equal to 0. Again, we’ll include 0 by drawing a closed circle, since we know that x can also be equal to 0. We’ll draw an arrow to the right, starting from 0 (and including 0) because these are the values greater than 0.
Additional Resources:
You can enrich your lesson on inequalities and their graphs by using diverse multimedia materials, such as this free video. It contains simple explanations of checking solutions of inequalities, as well as guidelines on graphing inequalities.
For students with more advanced math skills, you may also want to check out our article on solving inequalities. It contains detailed teaching instructions on solving inequalities with one variable, as well as free worksheets and activities.
Activities to Practice Inequalities and Their Graphs
Inequality Race
This is a fun and fast-paced game that will help students hone their skills at checking solutions for inequalities. To use this game in your classroom, you’ll need to create task cards with math problems on them.
Each task card contains one problem connected to checking whether a number is a solution to an inequality. The task card should contain the inequality, such as 27 ≤ 11x – 8, one number as a potential solution, and the answer to whether the given number is or isn’t a solution.
Divide students into pairs and place the pile of cards in the middle. The cards should be face down. Explain the rules of the game. Player 1 draws one card and asks the other student to check if the offered number is a solution.
Player 2 should be unable to see the card (as it contains the answer). Player 2 performs the calculation in their notebook to check this as quickly as they can. They only have 30 seconds for this. You can also use a timer or a stopwatch on the kids’ phones.
After player 2 gives an answer, player 2 can finally show the card to tell them if their answer is correct. If it’s correct, they score 1 point. If it’s incorrect, they lose 2 points. The roles are then reversed and player 2 draws a card this time, whereas player 1 checks the solution.
The winner is the one with the most points in the end. Although this is a group game, homeschooling parents can adjust it by asking their older kids to join in.
True or False Inequality Quiz
In this game, kids will practice determining whether an inequality is true or false. To play the True or False Inequality Quiz in your classroom, you’ll need to prepare PowerPoint slides with quiz questions.
Each slide contains one math question on checking if a given inequality is true or false. For example, children should check if – 8 + 3 ≤ 3 – 8 is true. Make sure to also prepare an answer sheet for yourself.
Divide students into groups of 3 or 4 and provide instructions for the game. Each group is presented with one slide, i.e. one inequality problem. They should answer whether the inequality is true as quickly as possible. For each correct answer, they score 1 point.
In the end, the group with the most points is declared the winner of the game. You can also introduce a small prize for the winner, such as cutting down on their homework assignments for the next class.
Graphing Inequalities Group Work
This activity will help students practice their knowledge of inequalities and their graphs by graphing inequalities. To use this activity in your classroom, you’ll need construction paper, markers, and assignment sheets with different inequalities.
Write 3, 4 inequalities on each assignment sheet (one assignment sheet per group). The inequalities should be different in each group. Bring several sheets of construction paper (one per group).
Divide students into groups of 3 or 4 and distribute the assignment sheets, markers, and construction paper to each group. Provide instructions for the activity. The members of each group work together.
They should graph the inequalities from their assignment sheet by drawing 3, 4 large number lines on the construction paper. Provide 10 minutes for this. After each group finishes their assignments, they present their collaborative work in front of the class.
Before You Leave…
If you liked the strategies on teaching inequalities and their graphs that we outlined in this article, we have a whole lesson that is dedicated to this topic!
So if you’re looking for more math materials for children of all ages, sign up for our emails for plenty of free content! Feel free to also head over to our blog.
And if you’d like to become a member, sign up at Math Teacher Coach!
This article is based on:
Unit 3 – Solving Inequalities
- 3-1 Inequalities and Their Graphs
- 3-2 Solving Inequalities Using Addition and Subtraction
- 3-3 Solving Inequalities Using Multiplication or Division
- 3-4 Solving Multi-Step Inequalities
- 3-5 Working with Sets
- 3-6 Compound Inequalities
- 3-7 Absolute Value Equations and Inequalities
- 3-8 Union and Intersection of Sets